
Flotation recovery up 2.5% by holding grade on target
A base-metal sulphide concentrator. Cleaner flotation, closed loop.
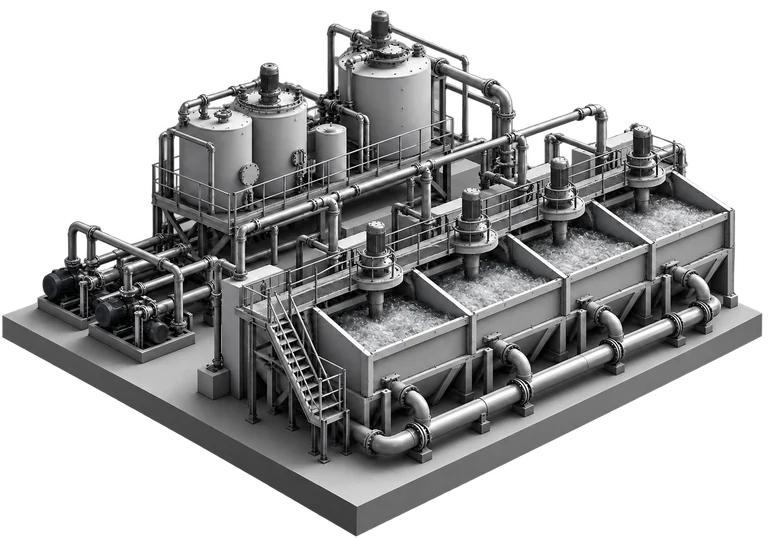
At a glance
| Commodity family | Base-metal sulphide |
|---|---|
| Circuit | Cleaner flotation |
| Control mode | Closed loop, model-predictive |
| Baseline | About six weeks under the incumbent controller |
| Assessment | About six weeks under closed-loop control |
| Comparison method | Matched historical periods, same machine |
The plant and the problem
Concentrate grade at this plant moved with feed grade, mineralogy, particle size and the air and reagent regime, and each of those moved on its own timescale. A controller reacting only to the current measurement corrected too late, and large setpoint changes fed variability straight back into the circuit.
The cost was felt downstream. The cleaner froth reports to concentrate separation, and swings in its volume and metal content forced more frequent changes there and raised the risk of losses. The incumbent controller, built on expert rules and fuzzy logic, held the process inside bands but could not anticipate: it did not account for the delay between an action and the grade response, nor for the very different update rates of the field instruments and the on-stream analysers.
What was controlled
A linear dynamic model of the flotation section was identified from historical time series. It fused the fast control-system signals with the irregular on-stream analyser results and predicted how metal content in the froth would move under different control actions.
| Manipulated | Air addition to the cells, pulp level setpoint, and gangue depressant flow |
|---|---|
| Controlled | Metal content in the flotation products, dart valve position and pulp level |
| Constraints | Product quality limits, permitted range for each manipulated variable, and a limit on how fast any setpoint may move |
| Disturbances | Feed grade and mineralogy, particle size, feed rate, equipment condition |
Field instruments updated every five seconds and the on-stream analysers roughly every twelve to fifteen minutes; the controller wrote new actions every sixty seconds. Each cycle it chose a sequence of moves that brought the predicted grade towards the target set by the plant's own technologists, applied only the first move, then re-forecast on the new data.
The control philosophy mattered as much as the model. Air and reagent were allowed to move often and finely, while pulp level was held steadier and moved decisively only on a change of regime. Operators kept the grade target and could take the controller out at any time.
Results
| Metric | Baseline | With closed-loop control | Change |
|---|---|---|---|
| Grade variability, standard deviation | 0.50% | 0.35% | −30% |
| Time below the lower grade limit | 44% | 25% | −19 points |
| Mean depressant consumption, both cells | 42.4 l/min | 24.3 l/min | −43% |
| Recovery | — | — | +2.5% |
Reagent control became more responsive rather than merely lower. In the machine's second cell the variability of depressant flow rose while its mean fell, which is the controller tracking the material flow instead of holding a fixed dose.
Air addition was higher and more active under predictive control, as the control philosophy intended.
How it was measured
The baseline is a continuous period of about six weeks under the incumbent expert-rule controller. The assessment period is a continuous period of about six weeks under closed-loop control, beginning about a month after the baseline ended. Both are drawn from the plant historian for the same cleaner machine, and the variability and quality-limit figures describe that machine.
The recovery figure is reported by the plant at circuit level rather than for the single machine, so it sits on a different footing from the other three. The source material does not record confidence intervals, nor the normalisation applied for differences in feed between the two periods. Read the figures as the results recorded for this project, not as a controlled experiment.
What this means for your plant
Nothing here transfers automatically. What transfers is the approach: if your circuit spends measurable time outside its quality limits, and the reason is that control reacts rather than anticipates, the same method applies. Whether it is worth anything at your plant is a question your own data answers.
See it on your own plant
A desktop review of historian exports. No site visit.